Maps | Targets | Tabular Data | Spatial DataThe Lower New England - Northern Piedmont ecoregion includes portions of 12 states and the District of Columbia. It extends from southern Maine and New Hampshire with their formerly glaciated, lower mountain and lake-studded landscape through the limestone valleys of western Massachusetts and Connecticut, Vermont, and eastern New York. Rhode Island, eastern Massachusetts and Connecticut are distinctive in that the communities are more fire adapted including pitch pine and oak dominated forests on glacially deposited sandy till that forms a broad plain with many ponds. The Northern Piedmont in Maryland, northern Virginia and eastern Pennsylvania was never glaciated and is characterized by broad gently-rolling hills and valleys upon which dry oak woods and remnant mesophytic forests occur on remnant sites, steep slopes and ridgelines. For more, read or print the original report (pdf).
These maps will download as high quality pdfs.
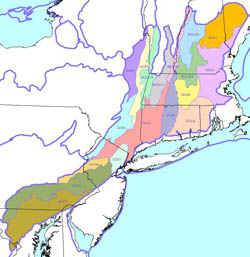
Ecoregion boundary and subsections,
pdfTerrestrial community subregions,
pdfBedrock geology,
pdfTopography,
pdfLandcover,
pdfEcological Drainage Units (EDUs),
pdfEcological Land Units (ELUs),
pdf EO Viability,
pdfManaged area ownership,
pdfMinor road-bounded block size,
pdfInitial potential matrix occurrences,
pdfPotential matrix occurrences by ELU,
pdfPotential matrix occurrences by dominant forest type,
pdfFull aquatic portfolio,
pdfGlossary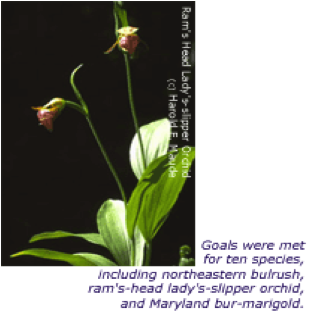
 Methods
 used to assess plant and animal conservation targets include target selection, goal setting, and viability assessments (downloads as a pdf). Plants selected for the portfolio are in the plan report's species results section (
pdf).
Ecoregional targets: terrestrial ecosystems and communities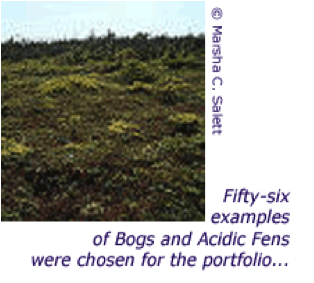 Methods
 used to assess community conservation targets, including target selection, goal setting, and viability assessment (downloads as a pdf). Communities selected for the portfolio are in the plan report's terrestrial ecosystems and communities results section (
pdf). The national vegetation classification for Lower New England is documented in
Plant Communities of the Lower New England-Northern Piedmont Ecoregion, by Julie A. Lundgren, 2000.
Ecoregional targets: matrix forests: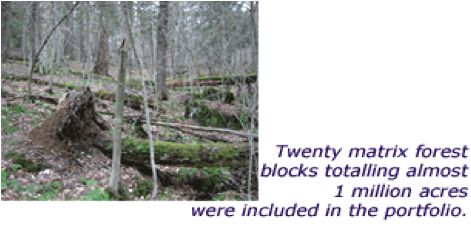 Methods
 used to develop and assess matrix-forming ecosystem conservation targets. Matrix forest examples selected for the portfolio are in the plan report's matrix-forming ecosystem results section (
pdf).
Ecological Land Units (ELUs) are introduced in the methods chapter, but without much technical description. Since the original LNE/NP assessment, a new spatial dataset for ecological systems has been developed. Read more about ELUs in the supplementary metadata for systems30 raster data (
.doc download).
Block reports are pdf documents that summarize all important descriptive and quantitative information about a matrix block. They were created for the 128 matrix blocks that formed the basis for the final portfolio selection of 95 high priority and alternate matrix blocks. Annotations have been added to the reports on those blocks that were changed in some way but still appear in the final set. A map of the spatial arrangement of blocks is shown below.
Ecoregional targets: aquatic systems: Methods
 used to assess aquatic conservation targets, including target selection, goal setting, and viability assessment. Aquatic systems selected for the portfolio are in the plan report's aquatic results section (
pdf). Download a slideshow of ecoregional planning for aquatic biodiversity in Lower New England, by Arlene Olivero in 2003,
here (ppt, 80mb).
The five Lower New England Ecological Drainage Units (EDUs) are the Merrimack, Upper Connecticut, Middle Connecticut, Lower Connecticut, and Cape Cod. For these EDUs, the following tables have summary data and are ready to print (Microsoft Excel downloads).
- Summary of fish and mussel distribution by HUC8 watershed (download)
- Size 2 aquatic system biophysical setting summary (download)
- Size 3 aquatic system biophysical setting summary (download)
These tables and more can be found in the
appendices section of this page.
Download all LNE spatial data in one zip file
here (1.3gb).
| Dataset name |
Definition |
|
Vector Data |
| blocks |
Road, utility line, railroad, and major hydrography line and polygon features used to build ecosystem blocks; chosen for impact on biodiversity. |
| census |
Housing unit density for the U.S. census block groups in 1960-1990 and estimates for 2000-2040. |
| cerclis |
Point sources of pollution: EPA Superfund data used in aquatic condition analysis. |
| cities |
Major cities (over 10,000) in LNE. |
| counties |
Line and polygon boundaries for counties in Northeastern U.S. |
| dams |
National inventory of dams, used in aquatic condition analysis. |
| dws |
Drinking water supplies, used in aquatic condition analysis. |
| ecoregions |
Ecoregion boundaries for the Eastern U.S. Source TNC ECS, based on USFS (Keys et al.) subsections and Natural Heritage Program. |
| ecosubsect |
Ecoregion subsection boundaries. |
| edu2001 |
Ecological Drainage Units. |
| gnis |
Place names: an automated inventory of physical and cultural geographic features in the U.S. |
| hucs_8digit |
Hydrologic Units for the Northeastern U.S.A. extracted from USGS 1994 dataset. |
| ifd |
Point sources of pollution: Industrial Facilities Discharge used in aquatic condition analysis. |
| lakes |
Lakes, ponds, and reservoirs polygons. |
| managedareas |
Managed areas: All managed lands with a conservation purpose along with other large state or federally managed lands greater than 500 acres. |
| matrix |
Viable matrix forest examples in the LNE ecoregion. |
| mines |
Point sources of pollution: mining operations, mineral deposits, processing plants. |
| minorroads |
Minor roads, railroads, utility lines, and major hydrological linework. |
| mjrds |
Major roads: U.S. interstate and state highways and other major thoroughfares. |
| mjrds_blocks |
Major road-bounded blocks, including major roads. |
| mtx_tier12 |
Viable matrix forest blocks in LNE. Tier 1 are highest priority and are included in the portfolio. |
| pcs |
Point sources of pollution: Permit Compliance System used in aquatic condition analysis. |
| portfolio_aqua |
Aquatic systems portfolio as of 9-30-2002. |
| qsurf_e |
Surficial geology: displays the surface distribution of Quaternary sediments. |
| rcris |
Point sources of pollution: Resources Conservation and Recovery Info system. |
| rdstrm_reg1 |
Road stream crossing points. |
| reg1shedpoly_s1 |
Size 1 watershed boundaries: Headwaters to small tributaries. |
| reg1shedpoly_s2 |
Size 2 watershed boundaries: Small to medium rivers. |
| reg1shedpoly_s3 |
Size 3 watershed boundaries: Medium to large rivers. |
| states |
State boundaries. |
| streams_reg1 |
USEPA OW River Reach File 3 (RF3) for USGS Drainage Region 1. |
| trails |
Trails: logging roads, fire roads, hiking and other trails not usable by ordinary vehicles. |
| tri |
Point sources of pollution: Toxic Release Inventory; Water release in 1995 used in aquatic condition analysis. |
|
Raster Data |
| dem30fill |
National Elevation Dataset: processed to fill cell depressions or 'sinks' that reflect isolated surface error. Ground resolution approximately 30 meter. |
| systems30 |
Ecological systems: a composite of several different grids, intended to capture the biophysical character of the LNE/NP and NAC ecoregions, including landcover, elevation zone, geological substrate, and landform. Ground resolution approximately 30 meter. |
The tables that follow will download as Microsoft Excel files.
Species tables:All species, primary and secondary targetsViable invertebrate targets - Distribution, stratification, and goalsProgress toward goalsViable primary vertebrate targets - Distribution, stratification, and goalsNumber EOs in portfolio sitesSecondary targets with no EOsSpecies in ESACommunities and ecosystems tables:Distributions of community associations - arranged by group type, subregion, and subsection with distribution and goalsCommunities by subregion - Compares the expert estimated numbers and subsection distribution of ecosystems with the total number and number of viable examples per subsection included in Heritage databasesEOs by matrix block and EOs by LCA are extracts that show community targets that occur within preferred matrix locations and proposed LCAs, respectively.Community goals by subsectionsMatrix forest tables:ELUs in the portfolioELUs by matrix blockMatrix blocks by stateAquatic tables:Aquatic targets detailed resultsAquatic results by size 2 watershedAquatic results by size 3 watershedAquatic portfolio occurrencesPortfolio occurrences variablesAccess database - allows for more detailed examination of the aquatic portfolio data, containining several pre-defined queries and reports. You must copy the database off this webpage and redefine it to be hte master, as described in the documentation.
EOs by subsection is an extract from lneoccurrence.xls that includes all species targets and their distribution across subsections. See the reference map below for subsections.