by Jim Smith
I've been building up to this one. At this point, our journey through the Spatial Data Quality series can be summed up in two sentences.
Overall percent agreement is rarely a sufficient indicator of map usability for a specific application, as explained in my
Overall Agreement blog. And, you need to understand the contingency table, as directed in my
Contingency Table/Error Matrix blog.
Let's move on ...
I will begin by using the contingency table example from the latter blog (Contingency Table/Error Matrix) and add a "Row Agreement" column and a "Column Agreement" row. Row Agreement is computed by dividing the number of sample points that agreed in a row by the total number of sample points in that row. Column Agreement is computed by dividing the number of sample points that agreed in a column by the total number of sample points in that column.
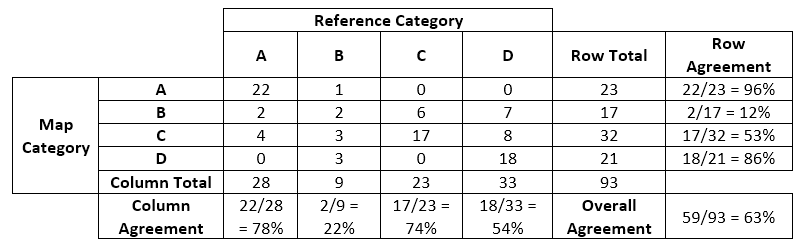
Now let's "interpret" those values. If the first group of assumptions I mentioned in the Overall Agreement blog is met, this is what those values mean:
-
Column Total: 23 sample plots were classified as Category C in the reference data. Ditto for the other columns.
-
Row Total: 17 sample plots were mapped as Category B. Ditto for the remaining rows.
-
Row Agreement example: If a pixel is mapped as Category A there is a 96% chance that it was also classified as a Category A in the reference data. Ditto for the other rows.
-
Column Agreement example: If a sample point was classified as a Category D in the reference data there is a 54% chance that it was also mapped as Category D in the map. Ditto for the other columns.
Note that row and column agreement are sometimes called User's and Producer's Accuracy, respectively. (Wait – or is it Producer's and User's Accuracy respectively? Though I can make an argument for either way to define who is interested in rows or columns, I won't go there now.
I will continue to call them Row and Column Agreement for clarity.) From those few simple values, I think that a person can really begin to explore the usability of this map for a particular application.
Summing up: following are a few takeaways from this contrived contingency table.
- The overall sample size is not really sufficient for statistical precision, including overall percent agreement. I would dearly, dearly love to have a larger assessment data set.
- The distribution of sample points across categories is highly variable, and any estimates for Category B are severely suspect.
- Row and column agreement are sometimes quite different for a particular category, like Category D. If I pick a pixel mapped as Category D, it is very likely (86%) that it actually was classified as a Category D in the reference data. Conversely, if I pick a sample point classified as a D in the reference data, it is about a 50-50 shot that it was mapped as a Category D. Which perspective is important to you as a user of this spatial product?
- Assuming more reference data isn't obtainable, if your primary interest is Category A, this map will probably prove useful to you.
- Assuming more reference data isn't obtainable, if your primary interest is in categories C or D, the map's usefulness depends on your perspective, e.g. row agreement or column agreement.
It is the map producer's responsibility to provide as much information as possible about a map's characteristics. However, it is the user's task to explore and make every effort to understand the map's characteristics
in the context of their application. There is more to this task than a single, catchy number.
Four down, two more to go. Next in the series: Local vs. Non-Local Accuracy -- Point of view matters!
Contact Jim